NL
NARS NL (1989 – 1992)
The NARS-NL project was initiated to investigate P-to-S converted phases from upper mantle discontinuities on a regional scale. The dense network of 13 broadband stations in the Netherlands, Germany and Belgium was deployed from 1989 till 1993. Its data enabled a variety of body and surface wave studies.
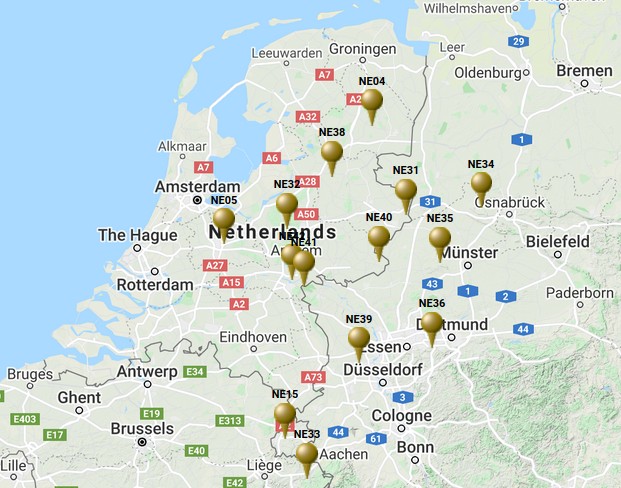
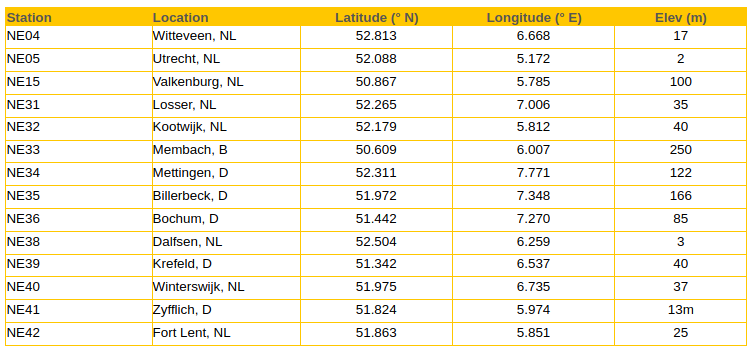
Station list & data
Alsina, D., Broadband seismological data studies; Validity of assumptions in surface wave studies and detailed structure of the upper mantle, Geologica Ultraiectina, 138, 163 pp., 1996.
Alsina, D., and R. Snieder, Small-scale sublithospheric continental mantle deformation: constraints from SKS splitting observations, Geophys. J. Int., 123, pp. 431-448, 1995.
Alsina, D., and R. Snieder, Constraints on the velocity structure beneath the Tornquist-Teisseyre zone from beamforming analysis, Geophys. J. Int., 126, 205-218, 1996.
Paulssen, H., S. Van der Lee, and G. Nolet, The NARS-Netherlands Project, IRIS Newsletter, 9 (4), 1-2, 1990.
Paulssen, H., B. Dost, and T. van Eck, The April 13, 1992 earthquake of Roermond (The Netherlands); first interpretation of the NARS seismograms, Geologie en Mijnbouw, 71, 91-98, 1992.
van der Lee, S., H. Paulssen, and G. Nolet, Variability of P660s phases as a consequence of topography of the 660 km discontinuity, Phys. Earth Planet. Inter., 86, 147-164, 1994.
Equipment
Datalogger
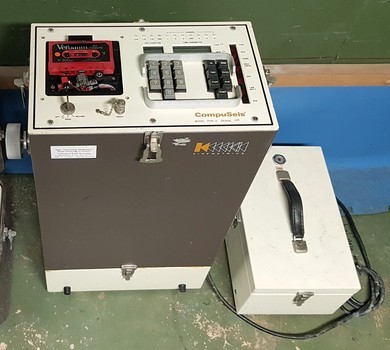 The Kinemetrics digital event recorder PDR-2 was one of the first mobile data loggers equipped with a microprocessor and therefore had a very low energy consumption. In the event of a power failure internal batteries took care to bridge this time. Data storage was done on a cassette tape. A 12 bit analog to digital converter (ADC) with gain ranging gave a dynamic range of more than 100dB. Time could (optionally) be synchronized with the GOES satellite, but due to the unfavorable position it could not be used at our locations. Alternatively we use the German longwave time signal called DCF77.
Data storage was approximately 10 hours at a sample rate of 125 ms. Due to the limited storage capacity, a trigger algorithm based on the short (STA) and long term (LTA) average had to be used.
Playback
The cassettes could be read on a PDR-2 which was connected to a computer. With a separate reading unit, the “Compuseis model CTU-1” and a chart recorder, the signal could also be displayed in the field. Later a TRS-80 portable computer was used for this. A plot program, written in “Basic”, showed the signal on a small LCD screen. Not a high accuracy, but a lot easier to carry than the CTU-1 with chart recorder.
-
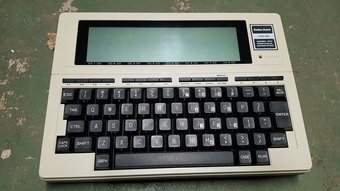
- TRS-80
-
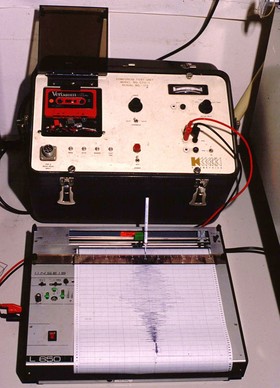
- CTU-1 with Linseis chard recorder
Seismometers
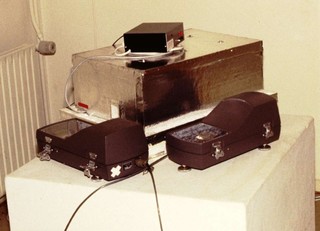 The station setup consists of two horizontal Kinemetrics SL-220 and one vertical SL-210 seismometer. The sensors are tuned to a eigenperiod of 12 seconds and by using a preamplifier with shaping filter the lower frequencies are significantly expanded. This made the vertical seismometer very temperature sensitive and therefore it had to be placed in a temperature controlled polystyrene box. A double-walled box, the inner box of which was lined with stone, is kept electronically at a fixed temperature.
Timing
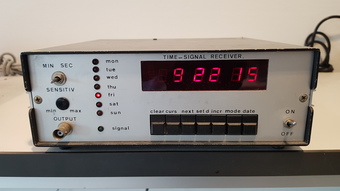
For time synchronization a DCF77 receiver, design by Elektor (1981), was built and modified to automatically synchronize the PDR-2’s internal clock to the nearest second. DCF77 is a German standard-frequency long-wave time signal and radio station near Frankfurt am Main broadcasting at 77.5 KHz. The signal carries an amplitude modulated pulse width coded 1 bit/s data signal. A 0.1 second pulse is a digital “0” and 0.2 second a “1”. The whole minute is marked by the absence of the 59th second. The receiver converts this into a pulse that is superposed on the E / W signal of the PDR-2 data logger. It served as an extra time check, should the clock elapse for more than 0.5 second due to circumstances.